Proper assessment of Stanford’s success in achieving a culture of sustainability depends heavily on tracking performance metrics and reporting them both internally and externally. A commitment to transparency and accountability helps the university strengthen its sustainability programs and services.
Results
Changes in Resource Consumption
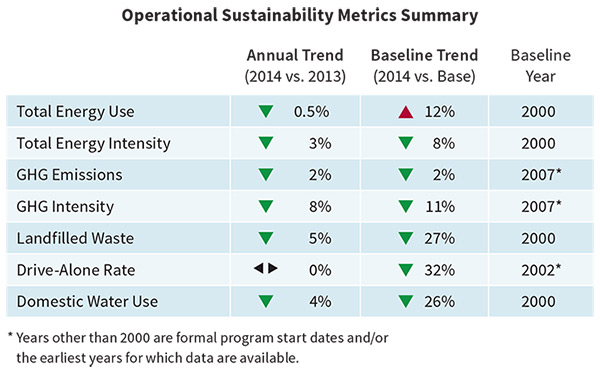
The first graphic below depicts trends in resource consumption this past year and compared to baseline program years. Key information on these trends includes the following:
- Because of consistent campus growth, total campus energy use has gradually increased over time, although it remained fairly steady between 2013 and 2014. The overall increase has been small relative to the growth of the campus footprint, meaning that energy intensity is decreasing.
- Decreases in energy intensity since 2000 reflect the effectiveness of construction of energy-efficient facilities as well as retrofits of existing buildings.
- Total water use has decreased substantially since 2000 due to the success of Stanford’s water efficiency programs. The university’s dedicated drought response efforts throughout 2014 have reduced its water consumption even further.
- The amount of campus waste that is landfilled has decreased significantly since 2000 as recycling and composting have become prevalent. The reduction from 2013 to 2014 brought Stanford’s diversion rate to an even 65%.
- Stanford has significantly lowered the number of commuters who drive to campus alone since 2002, and the percentage has remained steady at 49% since 2013.
Mindful of the continued growth necessary to support and advance its academic mission and enroll more students, Stanford maintains an unrelenting commitment to reducing its impact on resources. An analysis of absolute values over time demonstrates this trend. In the features section, operational departments and initiatives provide detail on the programs and services Stanford implements to improve efficiency, conserve resources, and ultimately reduce its impact while enhancing learning opportunities across campus.
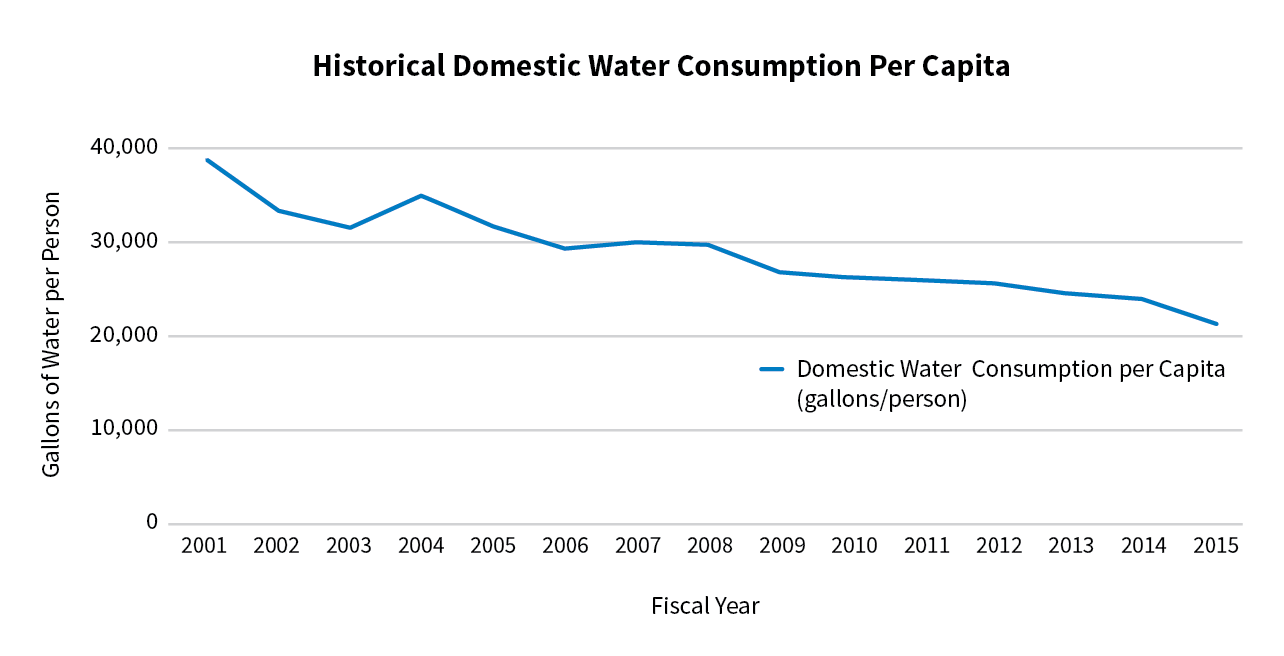
Individual Impact: A Look at Per Capita Consumption
In addition to tracking absolute consumption and intensity trends, Stanford considers annual per capita resource use. As the university grows to support its academic mission, responsible growth is both a priority and a tool for informing long-range strategic planning. As the total campus population continues to grow, the suite of efficiency and conservation programs implemented by the Department of Sustainability and Energy Management and its partner organizations ensures that each individual footprint shrinks. As a testament to these efforts, the chart below shows that per capita consumption has dropped in every category not only in the past year, but also compared to each baseline year. A detailed look at the magnitude of these per capita changes, demonstrated in the following charts, illustrates the effectiveness of resource management at Stanford.


The Road to Carbon Reduction
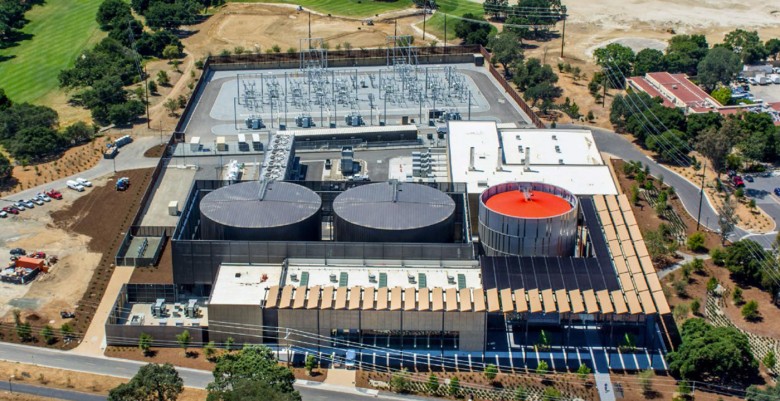
Stanford began operating its new Central Energy Facility (CEF) in April 2015. The substantial efficiency increase from the previous cogeneration plant will allow an immediate drop in emissions. Installation of 5.5 megawatts of onsite solar and 73 megawatts of offsite solar power will allow Stanford’s emissions to decrease by a total of 68% by the end of 2016.
Stanford pursues third-party verification of its annual emissions inventories, which means each year’s GHG emissions are not publicly reported until late the following year. In 2013, for the eighth consecutive year, Stanford completed and verified its inventory of Scope 1 and Scope 2 CO2 emissions, reporting approximately 181,700 metric tons of emissions through the Climate Registry. Stanford calculated approximately 178,800 metric tons of Scope 1 and Scope 2 CO2 emissions for 2014 (verification pending), a 2% decrease from 2013 levels. This decrease resulted largely from direct reductions in electricity and steam use on campus. Sustained reductions in steam use have also helped Stanford’s emissions fall to 2% below baseline levels, despite over 2 million square feet of growth since 2006. However, the primary drivers behind Stanford’s reduced GHG emissions over this period are the efficiency gains from new high-performing buildings and numerous retrofit programs, which together have contributed to a reduction in emissions intensity on campus of 11% since 2007.

This chart depicts the breakdown of Stanford’s total 2014 emissions. It includes Stanford University’s third-party-verified, publically reported Scope 1 and 2 emissions, which capture all direct emissions and indirect emissions from the purchase of electricity, heating, and cooling (discussed above). It also includes the emissions of Stanford Hospital and Clinics (SHC), and Scope 3 emissions from driving commuters and business air travel, bringing Stanford’s total emissions to 267,435 metric tons of CO2.